What expense reports show
Expense reports give you a clear picture of how your business spends money over time. They help you identify trends, spot unusual spending, and prepare for tax filing.
📍
Navigate to: Sidebar → Reports → Expenses
Accessing expense reports
- Go to Reports in the main navigation
- Select Expenses from the report types
- Choose a date range
- View the report
Report sections
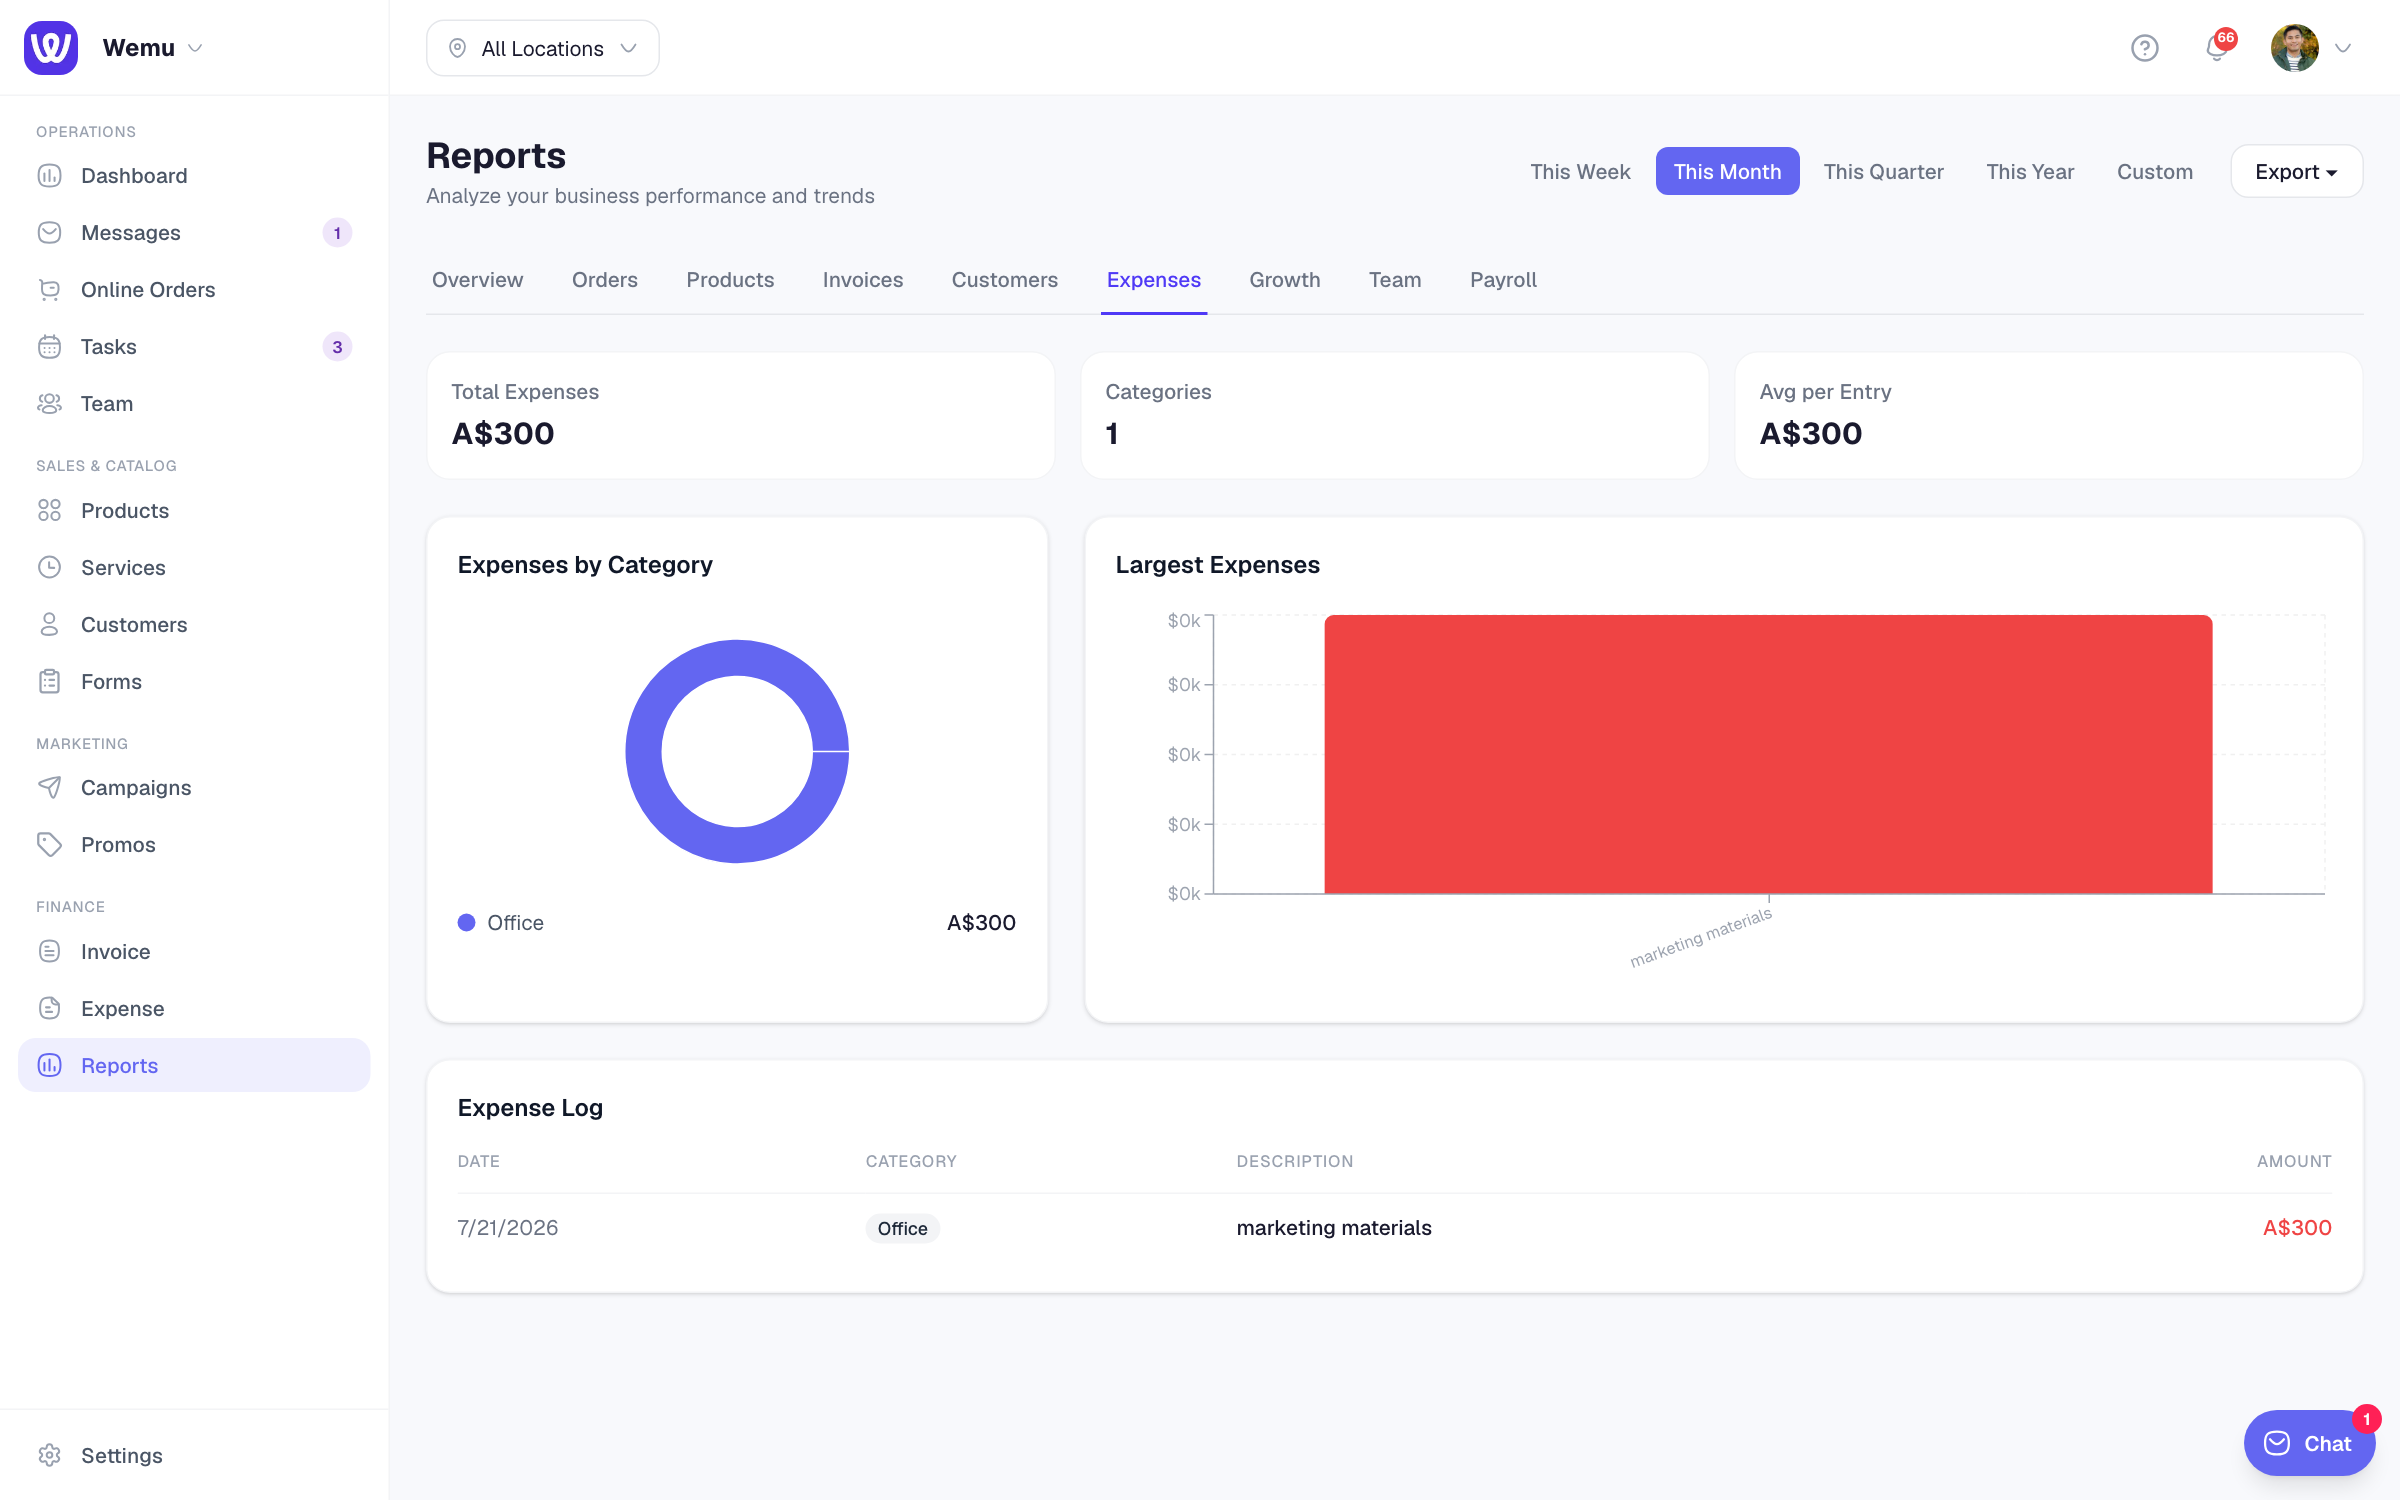
The expense report includes:
- Total Expenses — The sum of all expenses in the selected period
- Category Breakdown — A chart showing spending by category (e.g., 35% Rent, 20% Supplies, 15% Marketing)
- Monthly Trend — A line or bar chart showing how total spending changes month over month
- Top Expenses — The largest individual expenses in the period
- Branch Comparison — If you have multiple locations, spending per branch
Filtering reports
Narrow down your report with filters:
- Date range — This month, last month, this quarter, custom range
- Category — Focus on a single expense category
- Branch — View expenses for a specific location
- Amount — Filter by minimum or maximum expense amount
Understanding trends
Look for patterns in your expense data:
- Is spending going up or down month over month?
- Are any categories growing faster than revenue?
- Are there seasonal patterns (e.g., higher utility bills in summer)?
- Did a new branch significantly increase total expenses?
Tip: Review your expense reports at the end of every month, even if it's just a quick glance. Catching an unexpected spike in spending early lets you investigate and correct course before it becomes a bigger problem.
Exporting expense data
You can export expense reports for your accountant or for further analysis:
- Generate the report with your desired filters
- Tap Export
- Choose CSV (for spreadsheets) or PDF (for sharing)
- Download the file
The export includes all expense details: date, amount, category, branch, description, and receipt status.